Overview
As a UX/UI Designer at INRIX, I led the design of Safety View, a collaborative product developed by General Motors and INRIX. Safety View enables safety planners to analyze urban roadways to identify high-risk areas for pedestrians, micro-mobility users (scooters, bikes, etc.), and motorists. This project required an innovative approach to create a user-friendly and effective analytics tool for transportation safety professionals. My role encompassed the entire design process, from gathering requirements to delivering the final visual specifications.


Project Examples
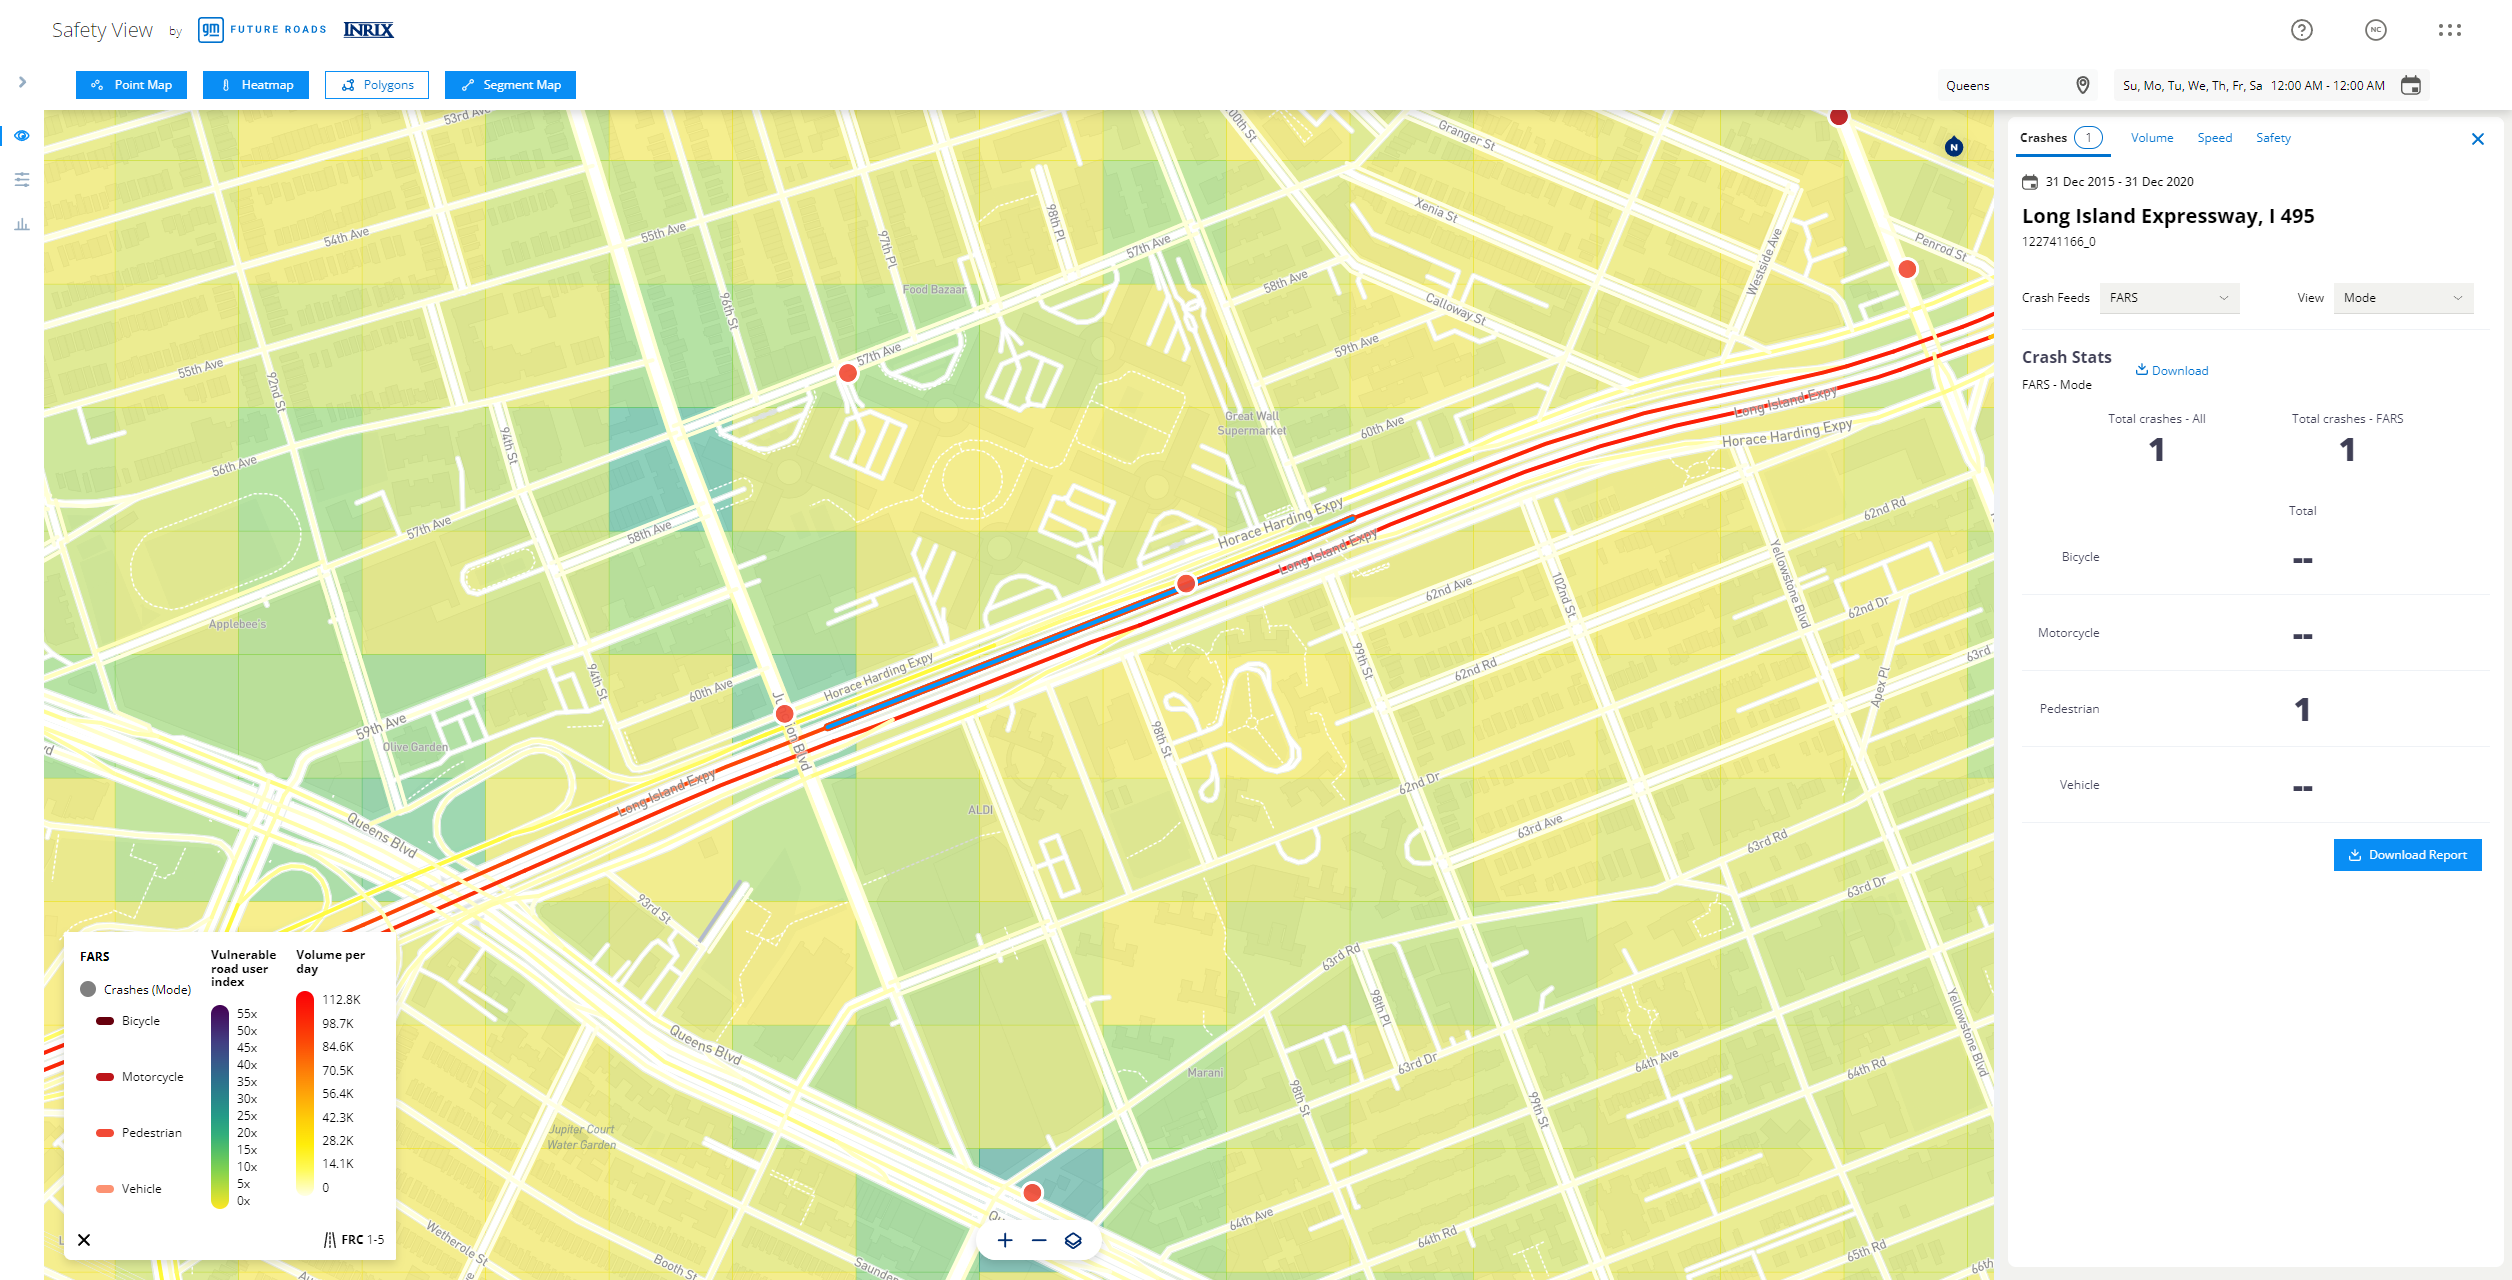
Holistic View of Crash Locations
Lead UX/UI Designer
Process:
- Requirements Gathering: Engaged with stakeholders and safety professionals to understand their needs for visualizing crash data. Conducted interviews and workshops to gather insights.
- Design Development: Developed wireframes and interactive prototypes to map out the visualization of crash locations. Ensured the interface was intuitive and customizable.
- User Testing: Performed usability tests with safety planners to refine the design based on their feedback. Iterated on the design to enhance usability and clarity.
- Final Visual Specs: Delivered detailed visual specifications and collaborated with developers to ensure accurate implementation.
Final Outputs:
- An interactive map displaying crash locations with filters for severity, mode, type, and contributing factors.
- Enhanced ability for users to identify high-risk areas quickly and effectively.
Impact:
- Improved safety planning efficiency by 25%.
- Positive feedback from safety planners on the ease of use and effectiveness of the tool.
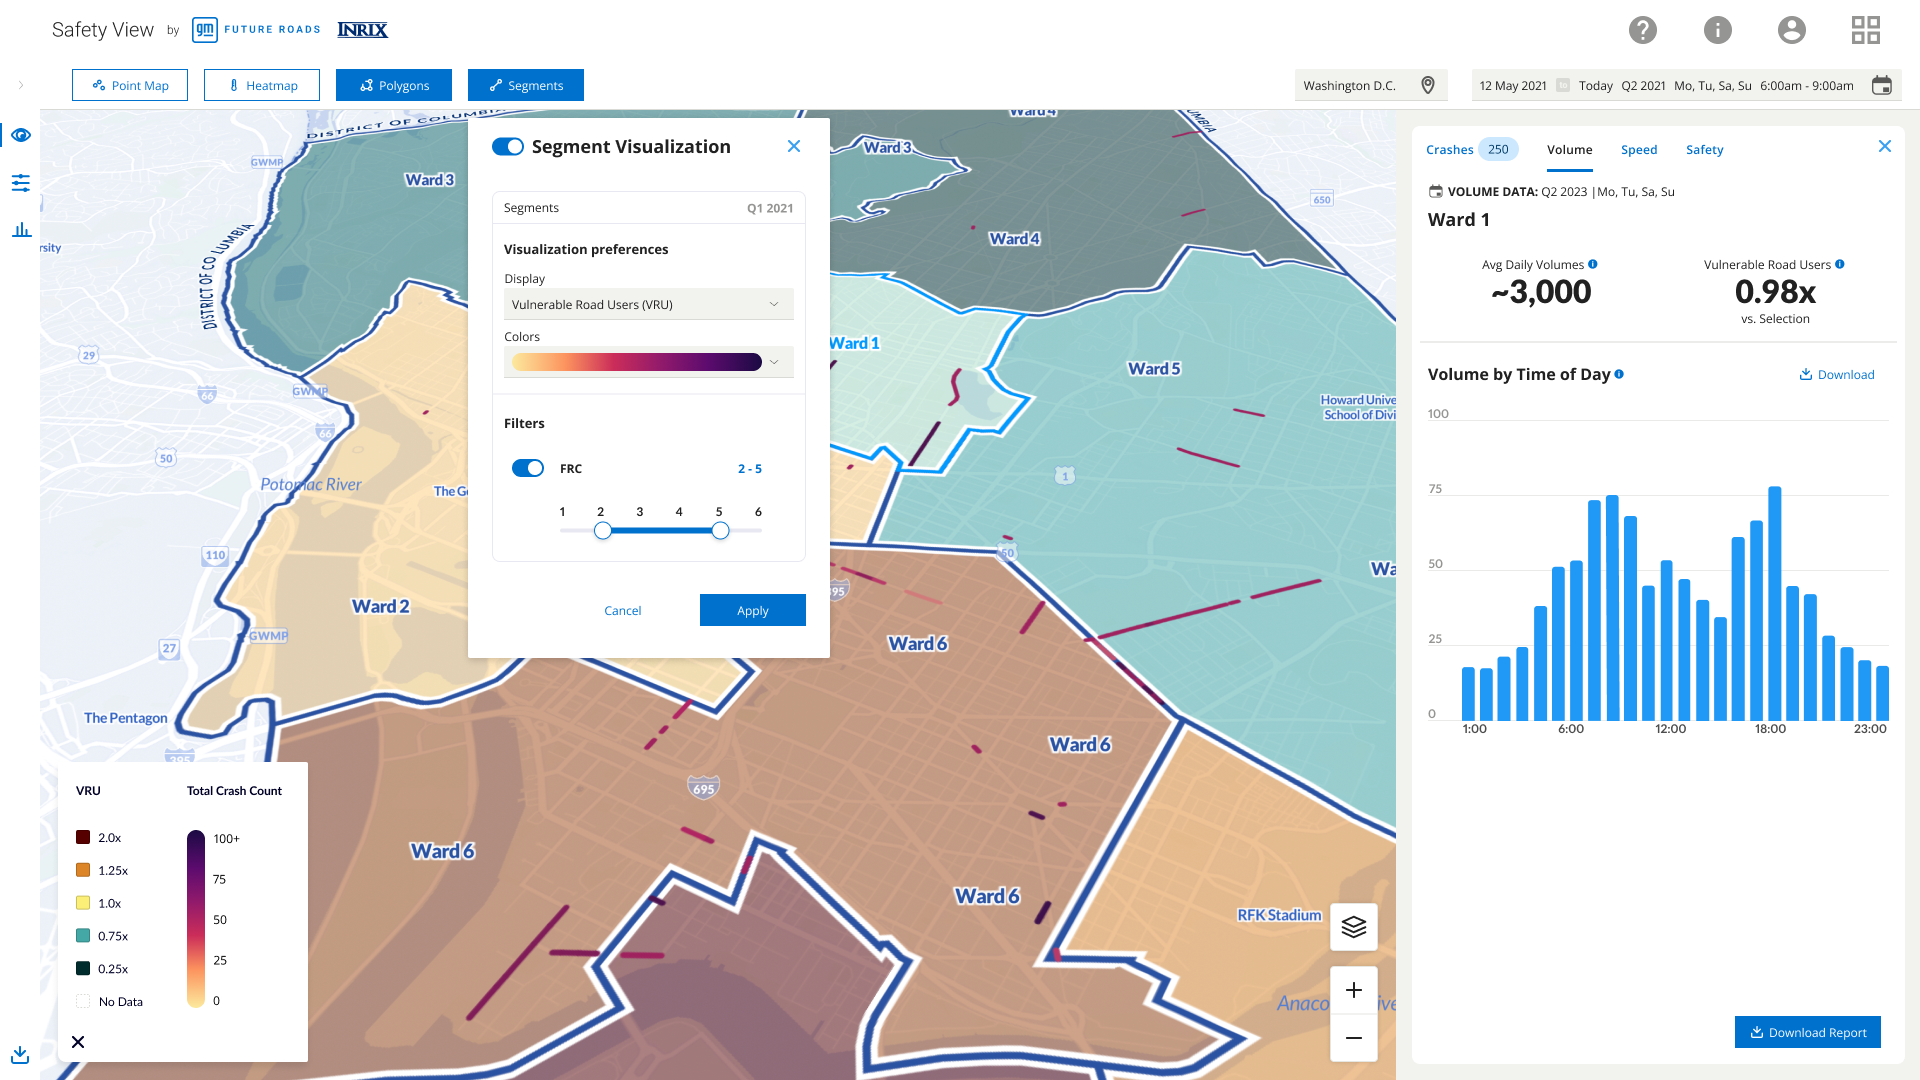
Risk Analyzer
Lead UX/UI Designer
Process:
- Requirements Gathering: Collaborated with data scientists and transportation experts to identify key risk factors and data sources. Conducted workshops to define user needs.
- Design Development: Created wireframes and prototypes for the Risk Analyzer module, incorporating various filters and data visualization techniques.
- User Testing: Conducted A/B testing to determine the most effective ways to present risk data. Gathered feedback to refine the design for clarity and usability.
- Final Visual Specs: Provided high-fidelity designs and worked closely with the development team to ensure the module met all requirements.
Final Outputs:
- A sophisticated yet easy-to-use Risk Analyzer tool that allows users to filter and visualize roadway segments based on specific risk criteria.
- Improved decision-making capabilities for safety professionals.
Impact:
- Users reported a 30% increase in their ability to identify and prioritize high-risk areas.
- Positive feedback from users on the usability and depth of the Risk Analyzer module.
Equity Lens for Safety Data
Lead UX/UI Designer
Process:
- Requirements Gathering: Worked with urban planners and community advocates to understand the need for incorporating equity considerations into safety planning. Conducted interviews and focus groups to gather insights.
- Design Development: Designed interfaces that overlay demographic data with crash and traffic data. Developed wireframes and prototypes to visualize equity-related insights.
- User Testing: Conducted usability tests to gather feedback on the equity visualization tools. Iterated on the design based on user input.
- Final Visual Specs: Delivered high-fidelity designs and collaborated with developers to ensure accurate implementation.
Final Outputs:
- An intuitive tool that combines demographic data with safety metrics to help users understand safety through an equity lens.
- Enhanced ability for users to identify and address equity issues in safety planning.
Impact:
- Users reported a 20% increase in their ability to incorporate equity considerations into their safety plans.
- Positive feedback from community advocates on the tool's ability to highlight equity issues.
Conclusion
Throughout my role as the lead UX/UI Designer for Safety View, I applied a rigorous and user-centered design process to create an impactful and effective solution for transportation safety analysis. Each project phase, from requirements gathering to final visual specs, was meticulously planned and executed, resulting in a platform that significantly improves safety planning, decision-making, and equity considerations for road users.
Safety View Product Page
