INRIX · Jun – Oct 2026
INRIX Parking Scorecard 2026
An editorial data site that ranks parking in 121 cities across North America and Europe. I designed and built it for journalists, from the data pipeline to the globe.
Impact: Live on inrix.com with 121 cities and 1,452 neighborhoods, backed by 247 automated data checks and WCAG 2.2 AA as a release requirement.
- Role
- Product Designer & Design Engineer (solo)
- Timeline
- Jun – Oct 2026
- Company
- INRIX
- Data Visualization
- Design Engineering
- Accessibility
- Editorial Design
- Responsive Design
- AI-Assisted Development

Walkthrough
The problem
INRIX puts out a Traffic Scorecard every year, and reporters cover it every year. Parking never had one and, as far as we know, nobody else had published one either. That's surprising given that INRIX has digitized 65,499 miles of curb and 363,322 parking lots.
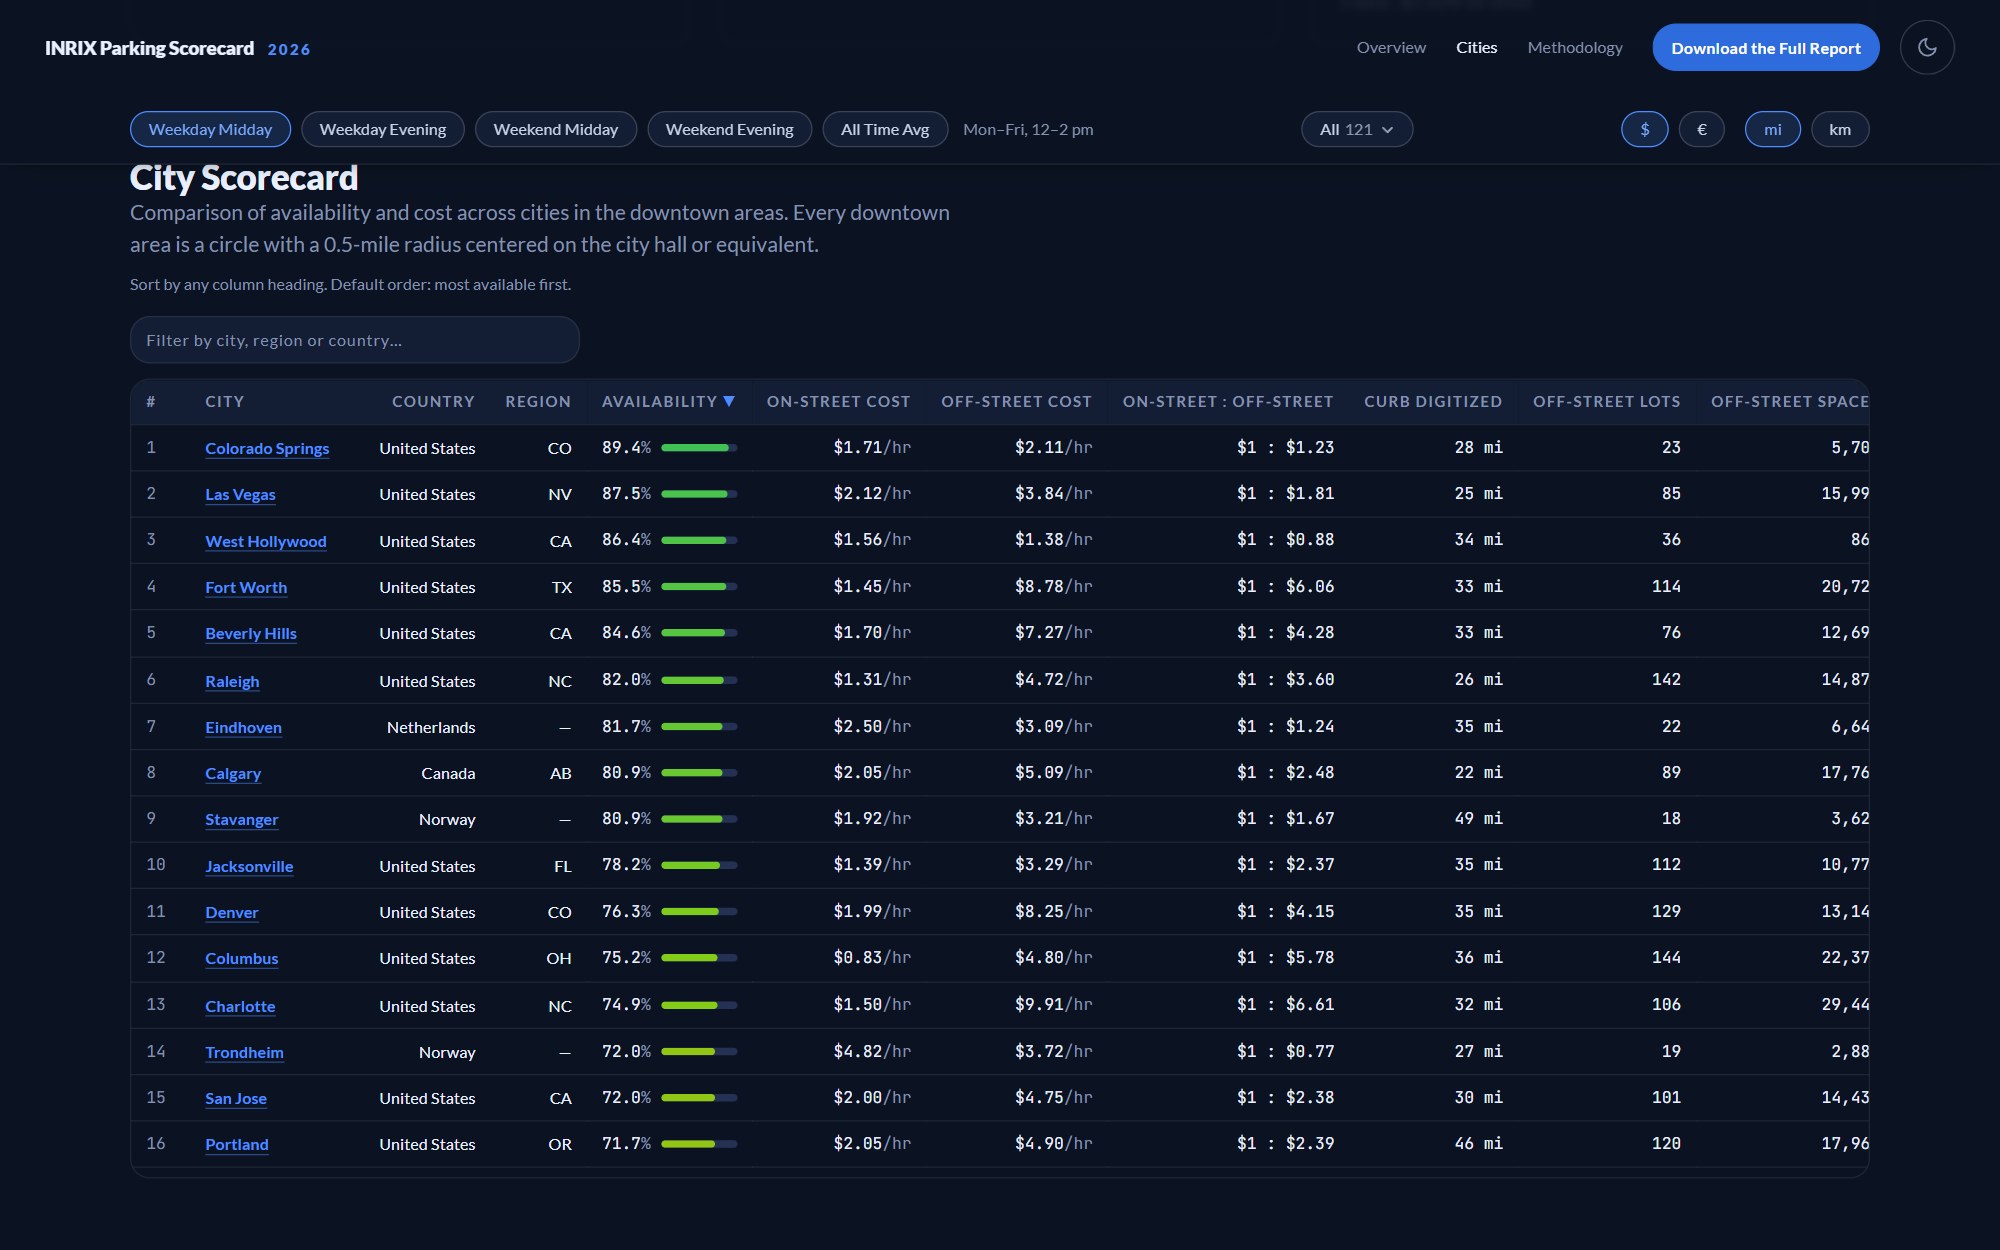
There were two readers I cared about most. A journalist on deadline needs a single number they can quote and a method that holds up with their editor. A city planner, on the other hand, wants to find their own neighborhood and see how it compares with the next city over.
Additionally, the scorecard had a job to do inside INRIX, which was to show how much parking data the company holds in a form that anyone can open and pass along.
Key decisions
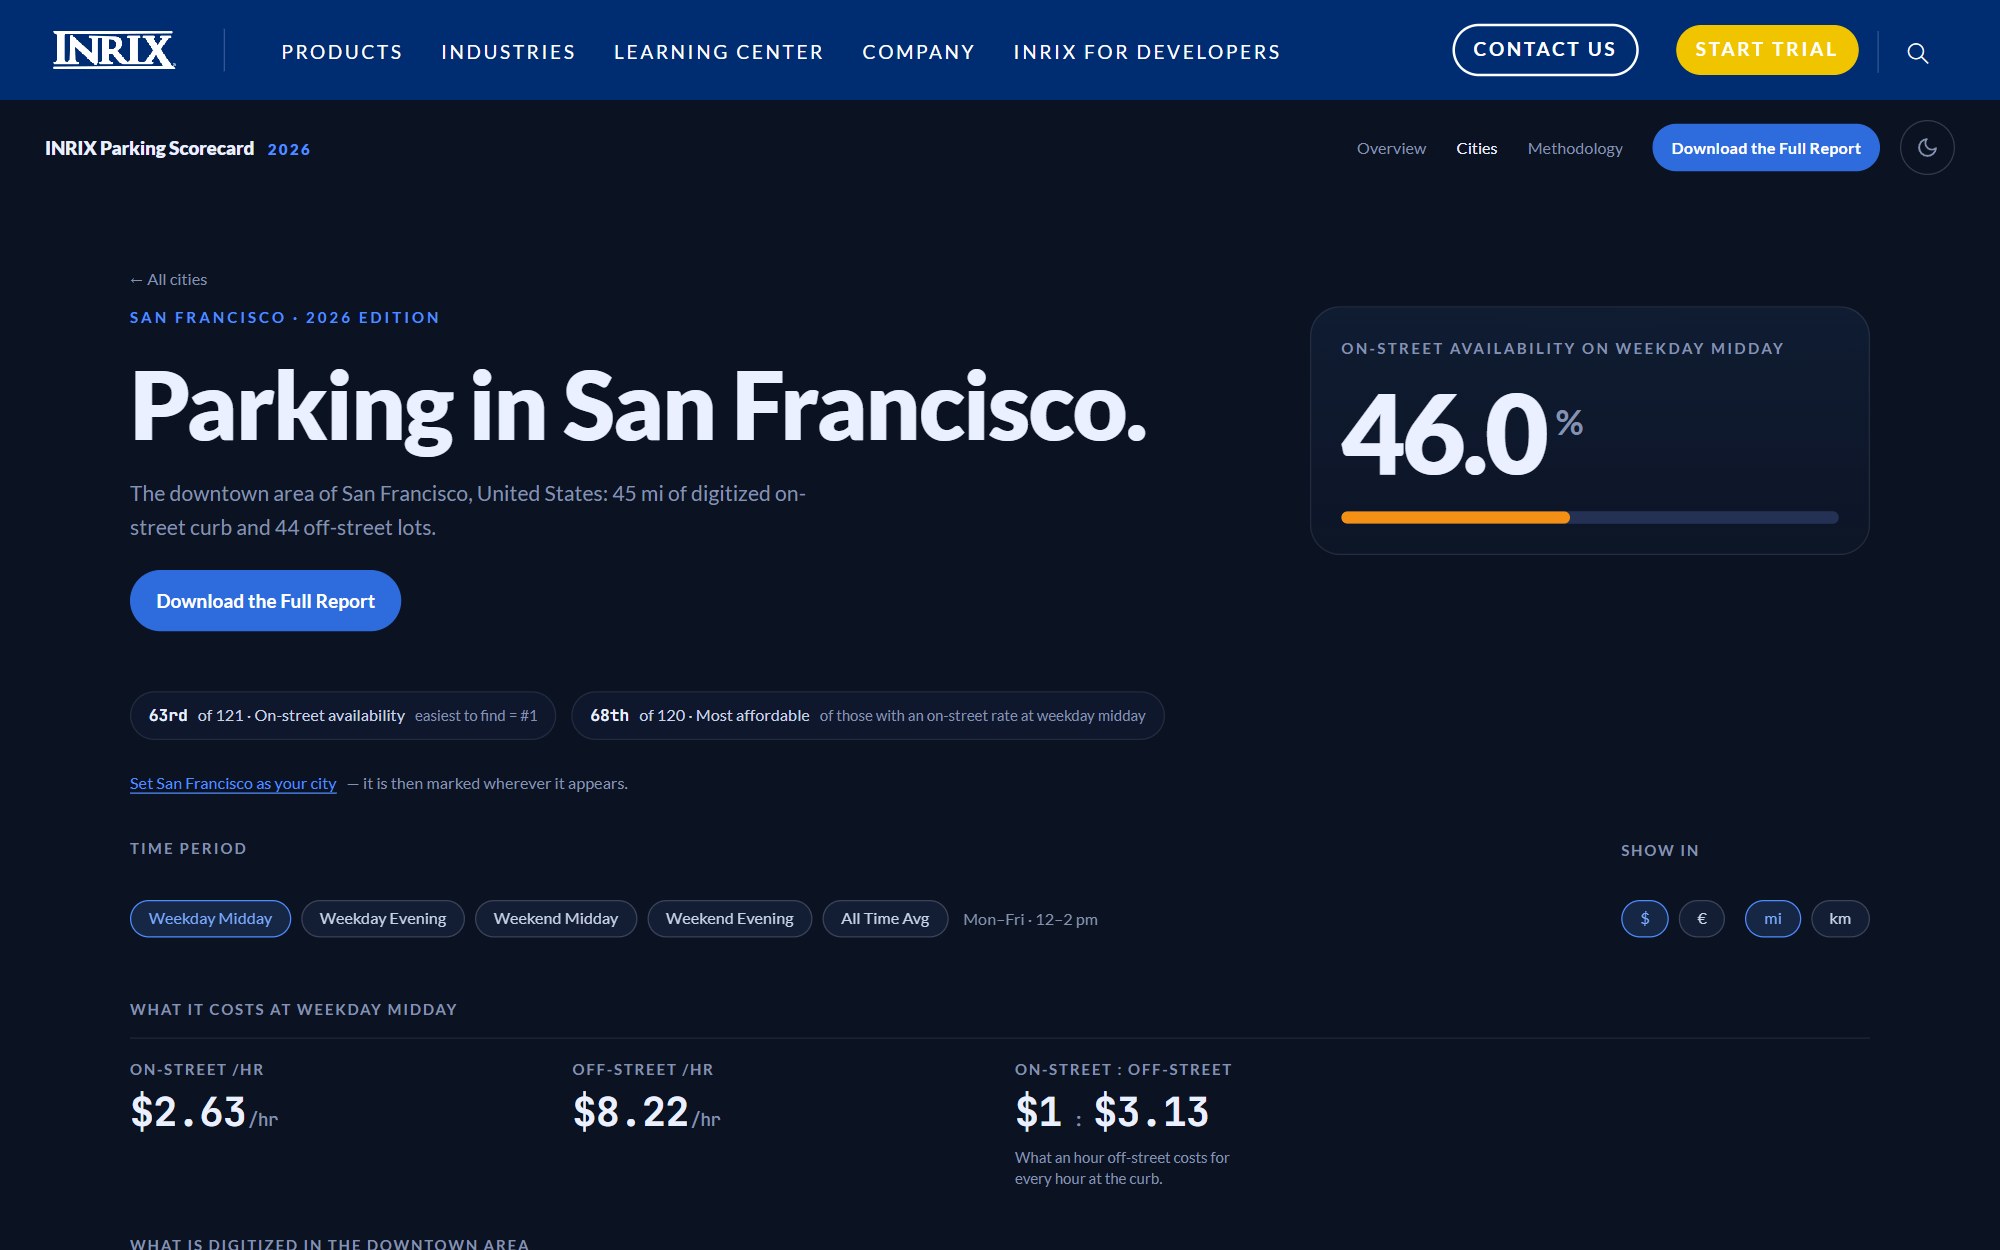
Lead with the number. Every city page opens on one figure that a reporter can lift straight into a story, like San Francisco's 46.0% on-street availability. Availability is the modeled probability that a driver finds an open on-street space on a typical block, and the headline uses weekday midday since it's the tightest of the four time windows. Rankings, prices, and maps come after, and "63rd of 121" sits next to the percentage to give it context. Our Signals Scorecard used A–F grades, but I dropped them here because a grade hides the number people actually want to quote. Instead, availability is drawn on one continuous color ramp.
Tell the scale as a story. "65,499 miles of curb" doesn't mean much to most people, so the overview is six scenes you scroll through where each one draws its number. It opens on an SVG globe with real coastlines, where all the curb INRIX has digitized wraps the Earth 2.6 times. A gauge-style arc was the obvious choice here, but I ruled it out because gauges read as scores and this is a distance.
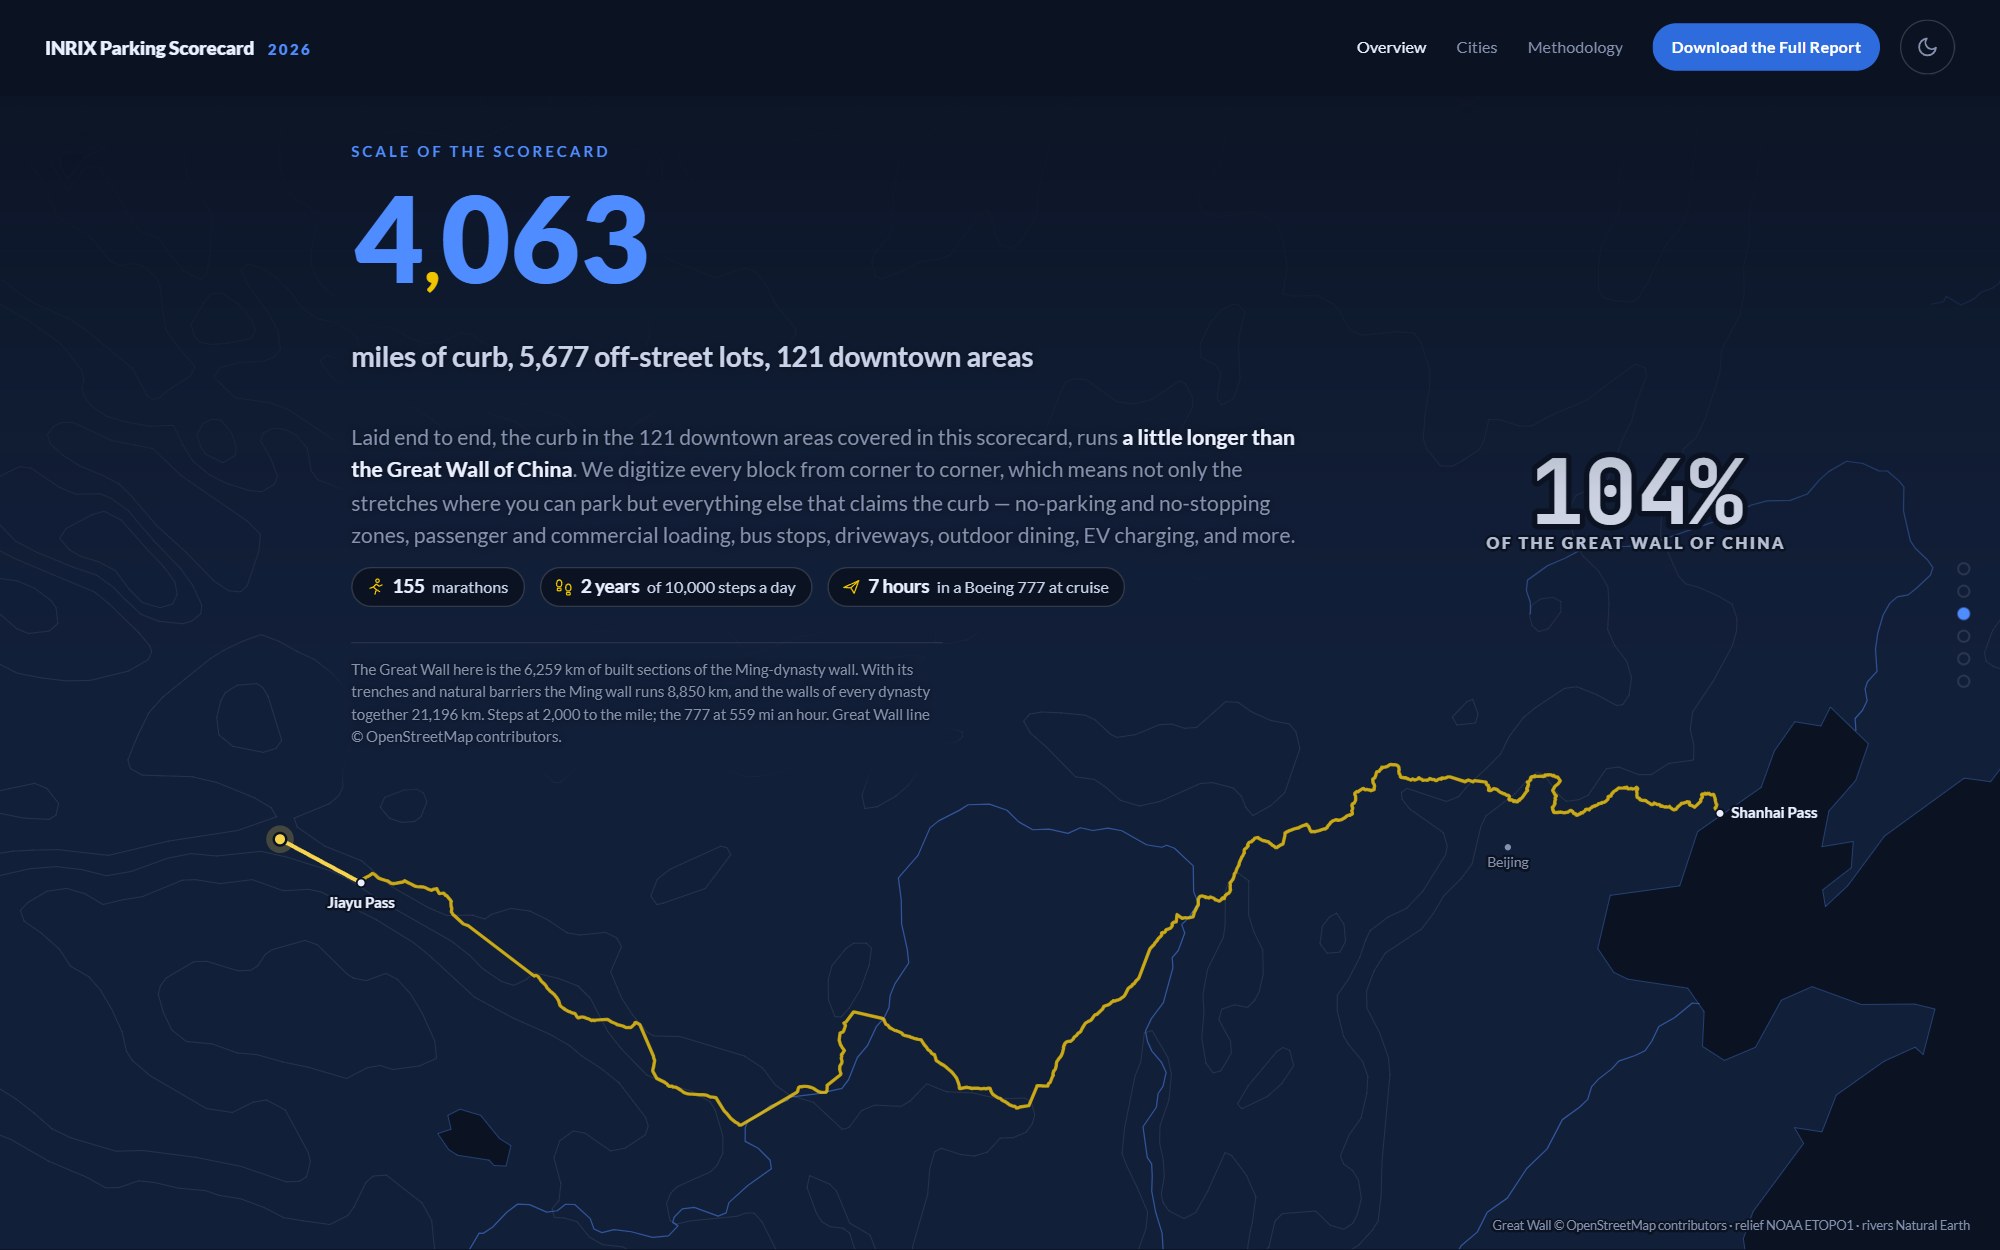
The next scene defines what a downtown area is: the same half-mile circle around every city hall, which is what allows a large city and a small one to be compared. Then the 4,063 miles of curb inside those 121 circles are traced along the Great Wall of China, running 4% past its end.
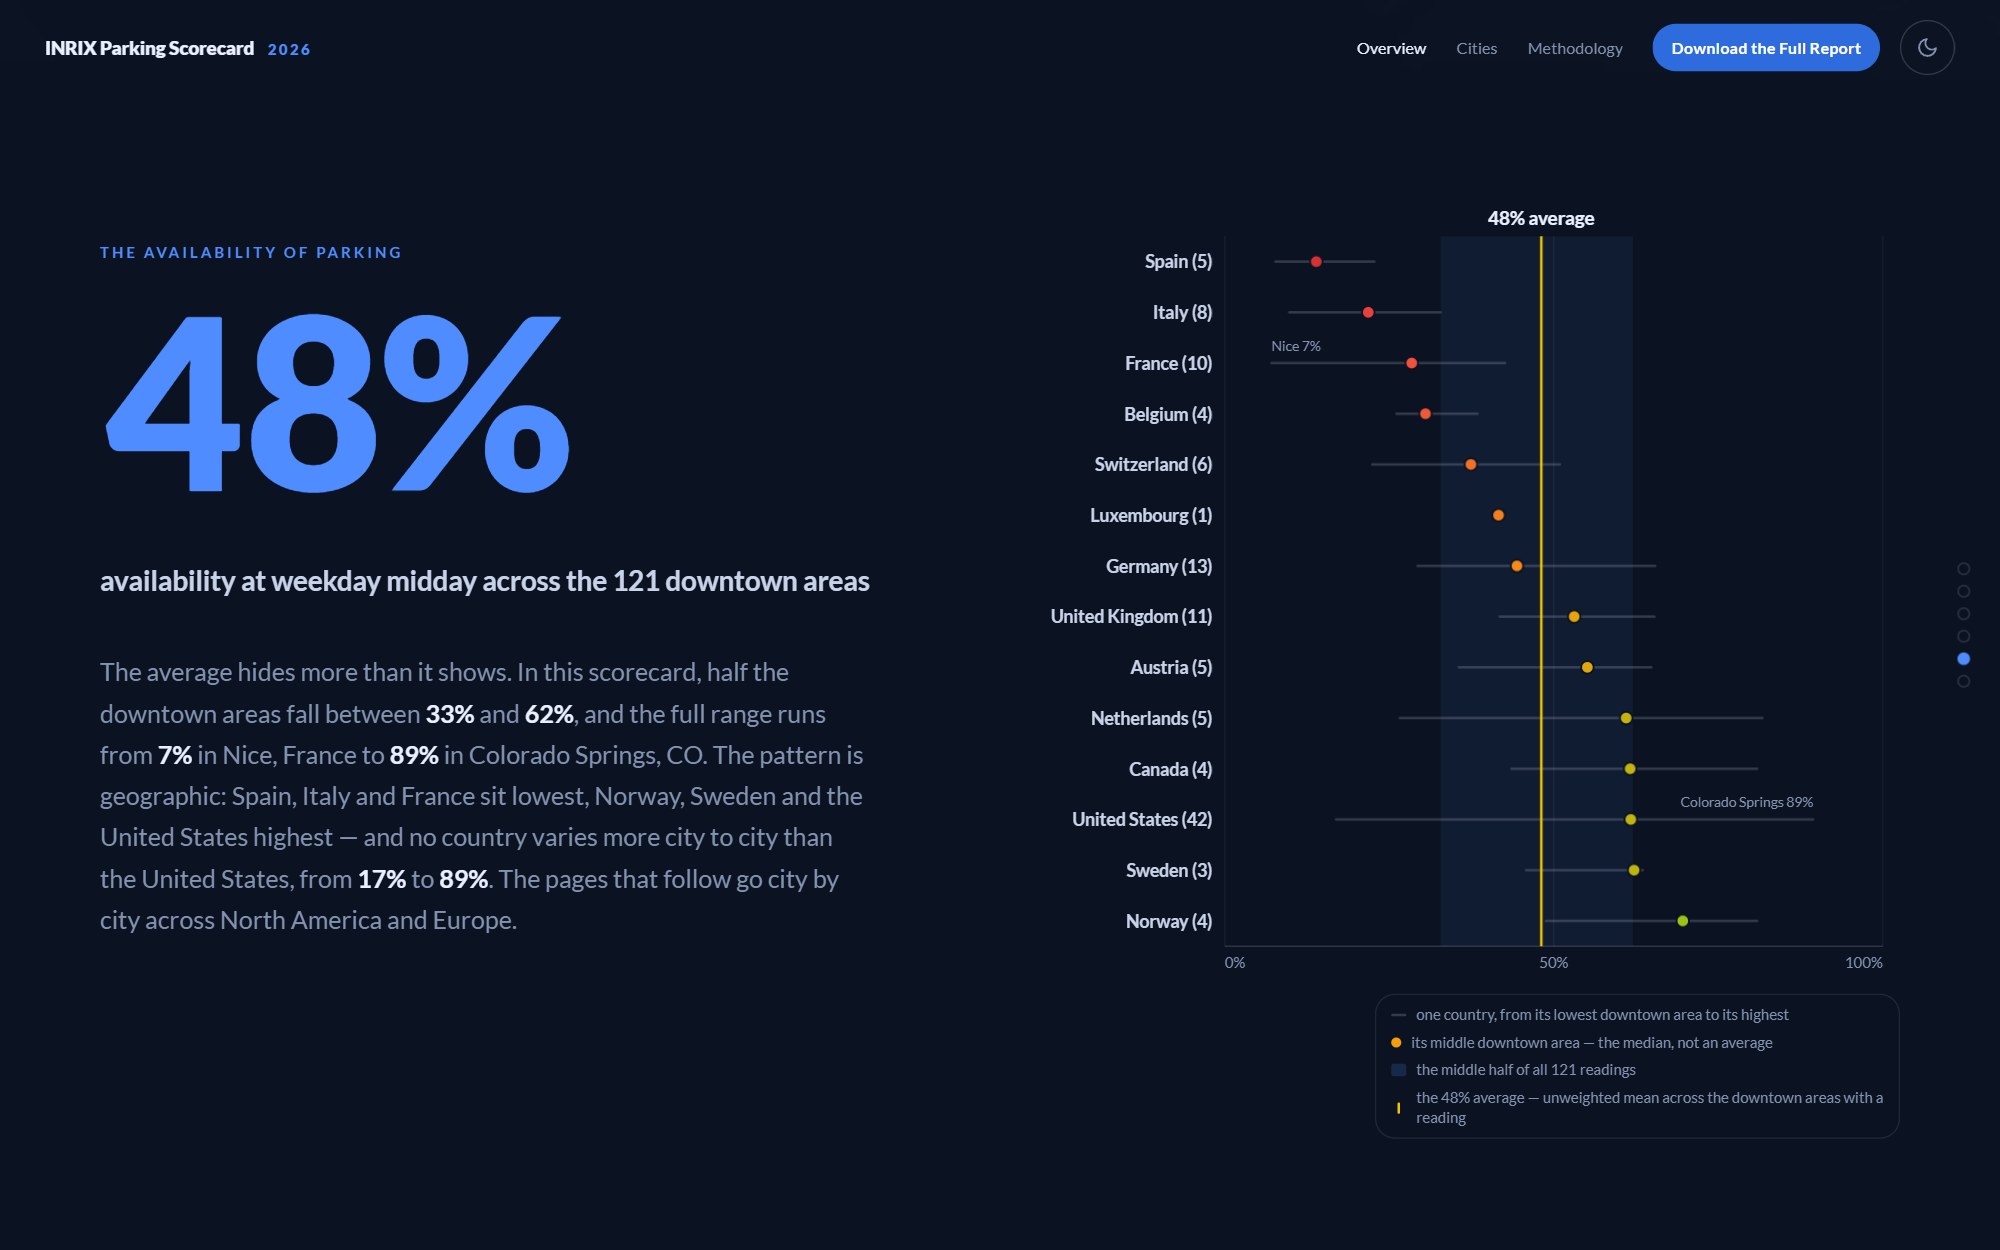
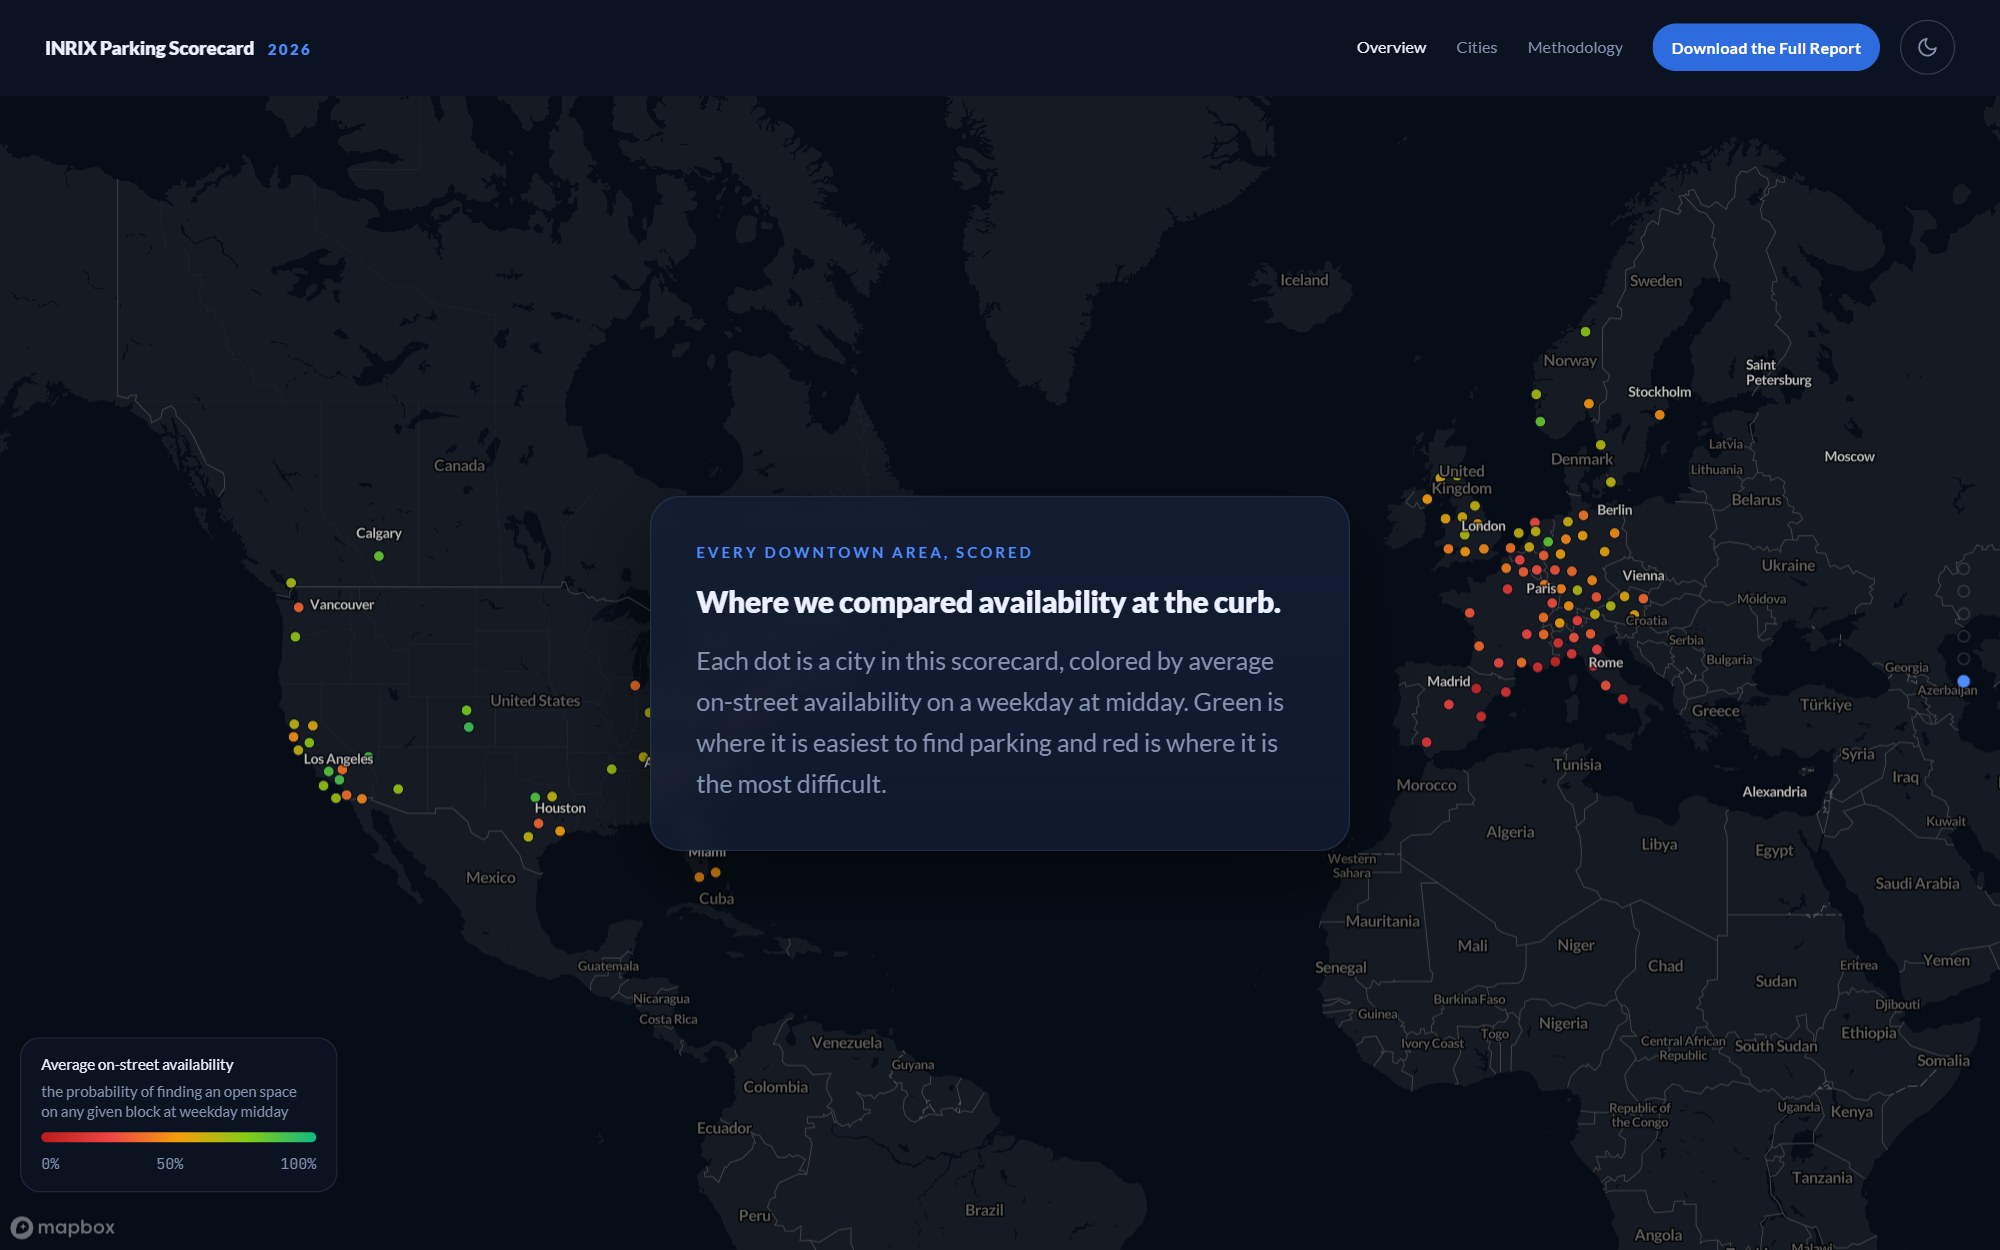
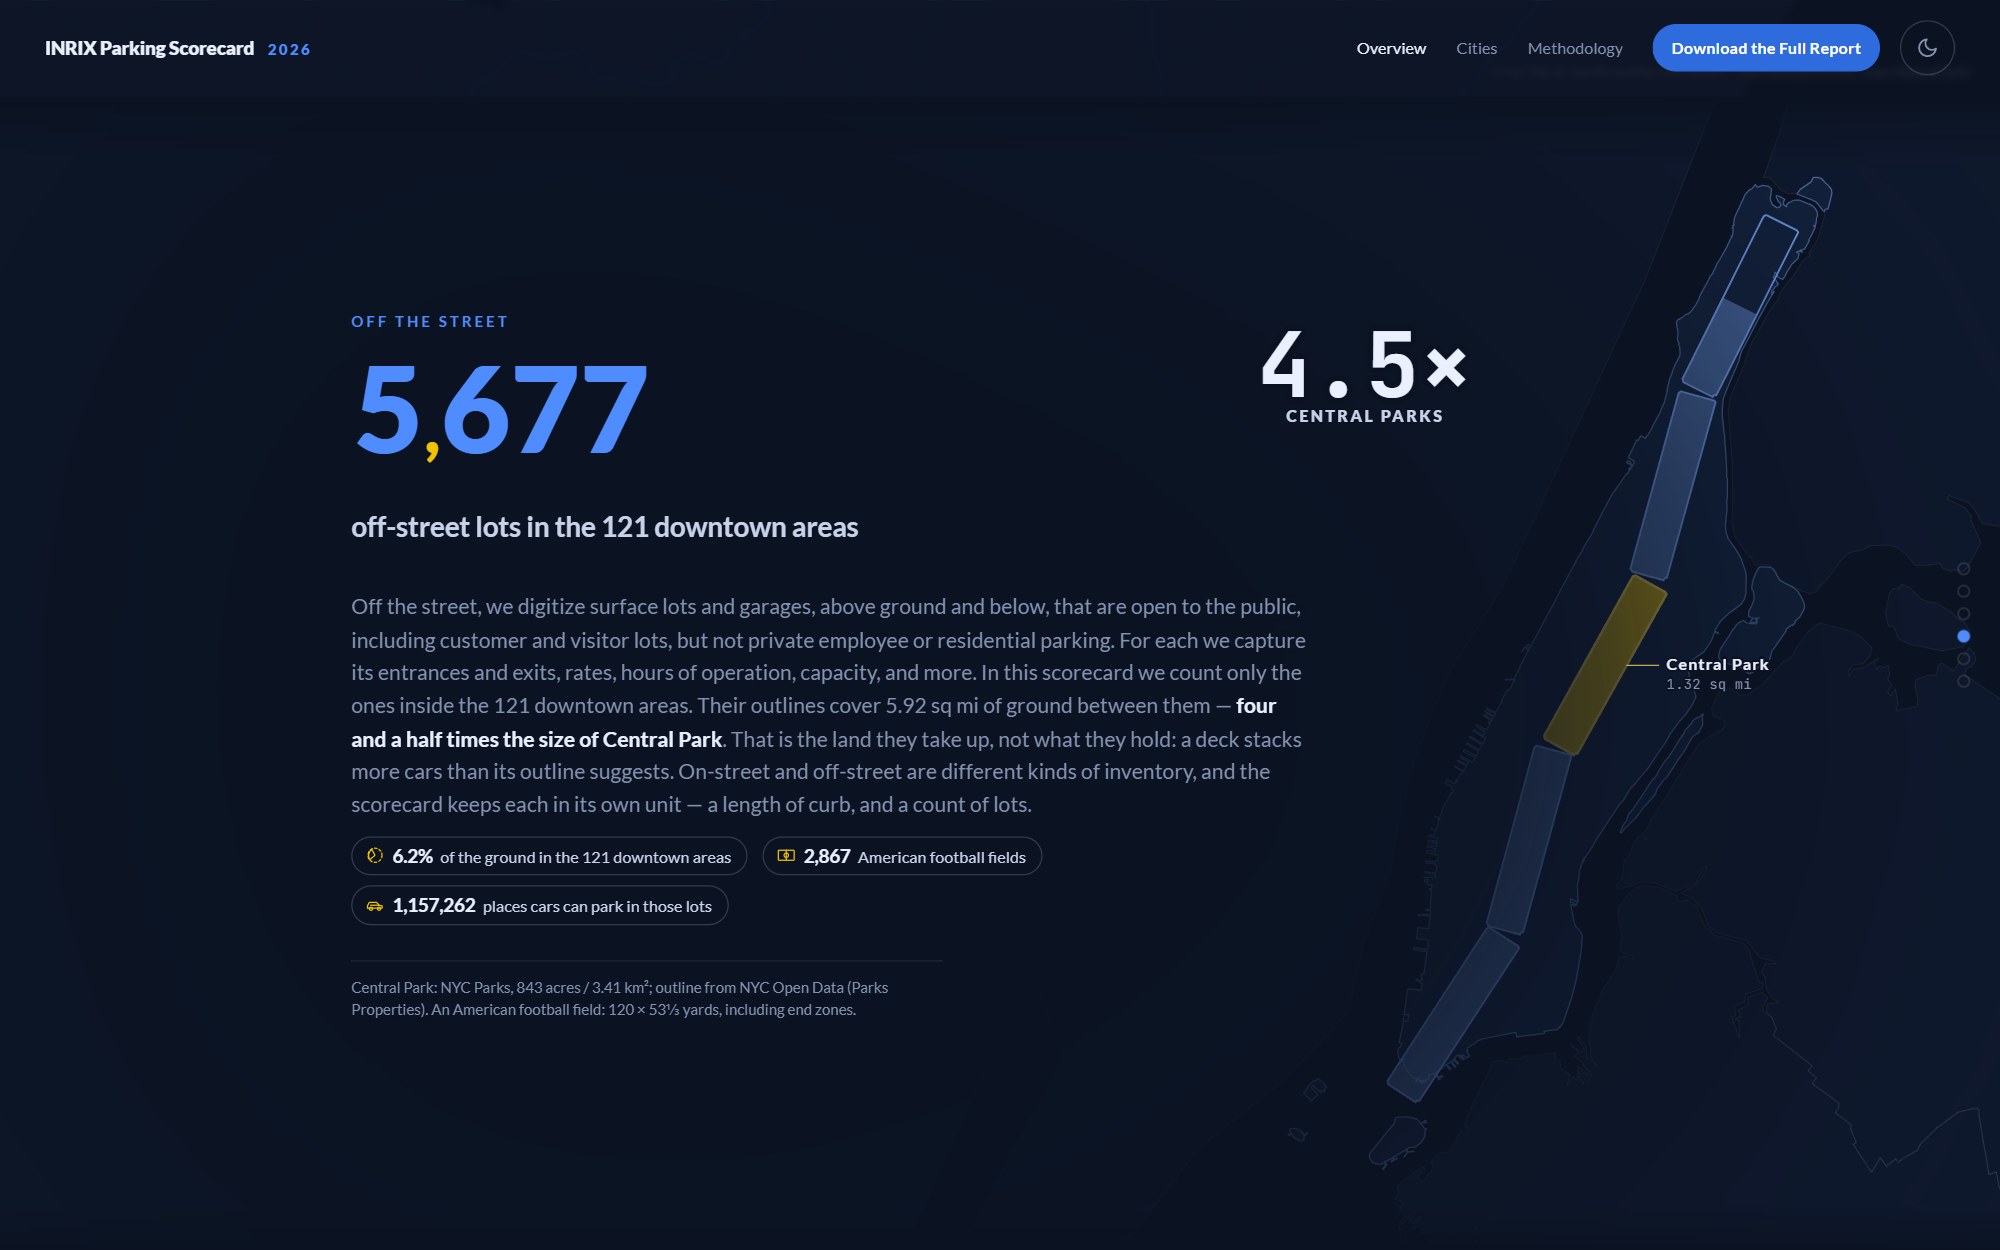
The 5,677 off-street lots get the same treatment, with their outlines covering four and a half Central Parks laid end to end up Manhattan. A chart of availability by country and a map of every city close out the overview and hand off to the rankings.
Never show a wrong number. The source data was changing under me for a month, and some of it arrived broken. The rule is that if a figure fails a check, its section is hidden and the page says why. I go into more detail on this below.
Outcome
It went live on October 7, 2026 at inrix.com/parking-scorecard/2026 with an overview, a ranking of all 121 downtown areas and 1,452 neighborhoods, a page per city, and a methodology page. The data is organized by edition, so the 2027 scorecard should mostly be a data update.
INRIX announced it with a press release in six languages. In the first two days the release was viewed 11,582 times and syndicated 488 times, on sites including AP News, Yahoo Finance, and Morningstar.
Working with real data
The site runs on INRIX's Curb Analytics export, and that export was a moving target while I built. Eight versions arrived between September 9 and October 5. Most of them were corrections, but a couple introduced new problems: one inflated curb lengths by as much as 478,599 times, and another shipped with the curb types blank.
I couldn't fix the data myself, so instead I decided what the site does when the data is wrong. Each risky figure has a status that the build works out for itself. When a status fails, the section that depends on it is hidden and the methodology page says what is missing. When a corrected export lands, the section comes back without any code change.
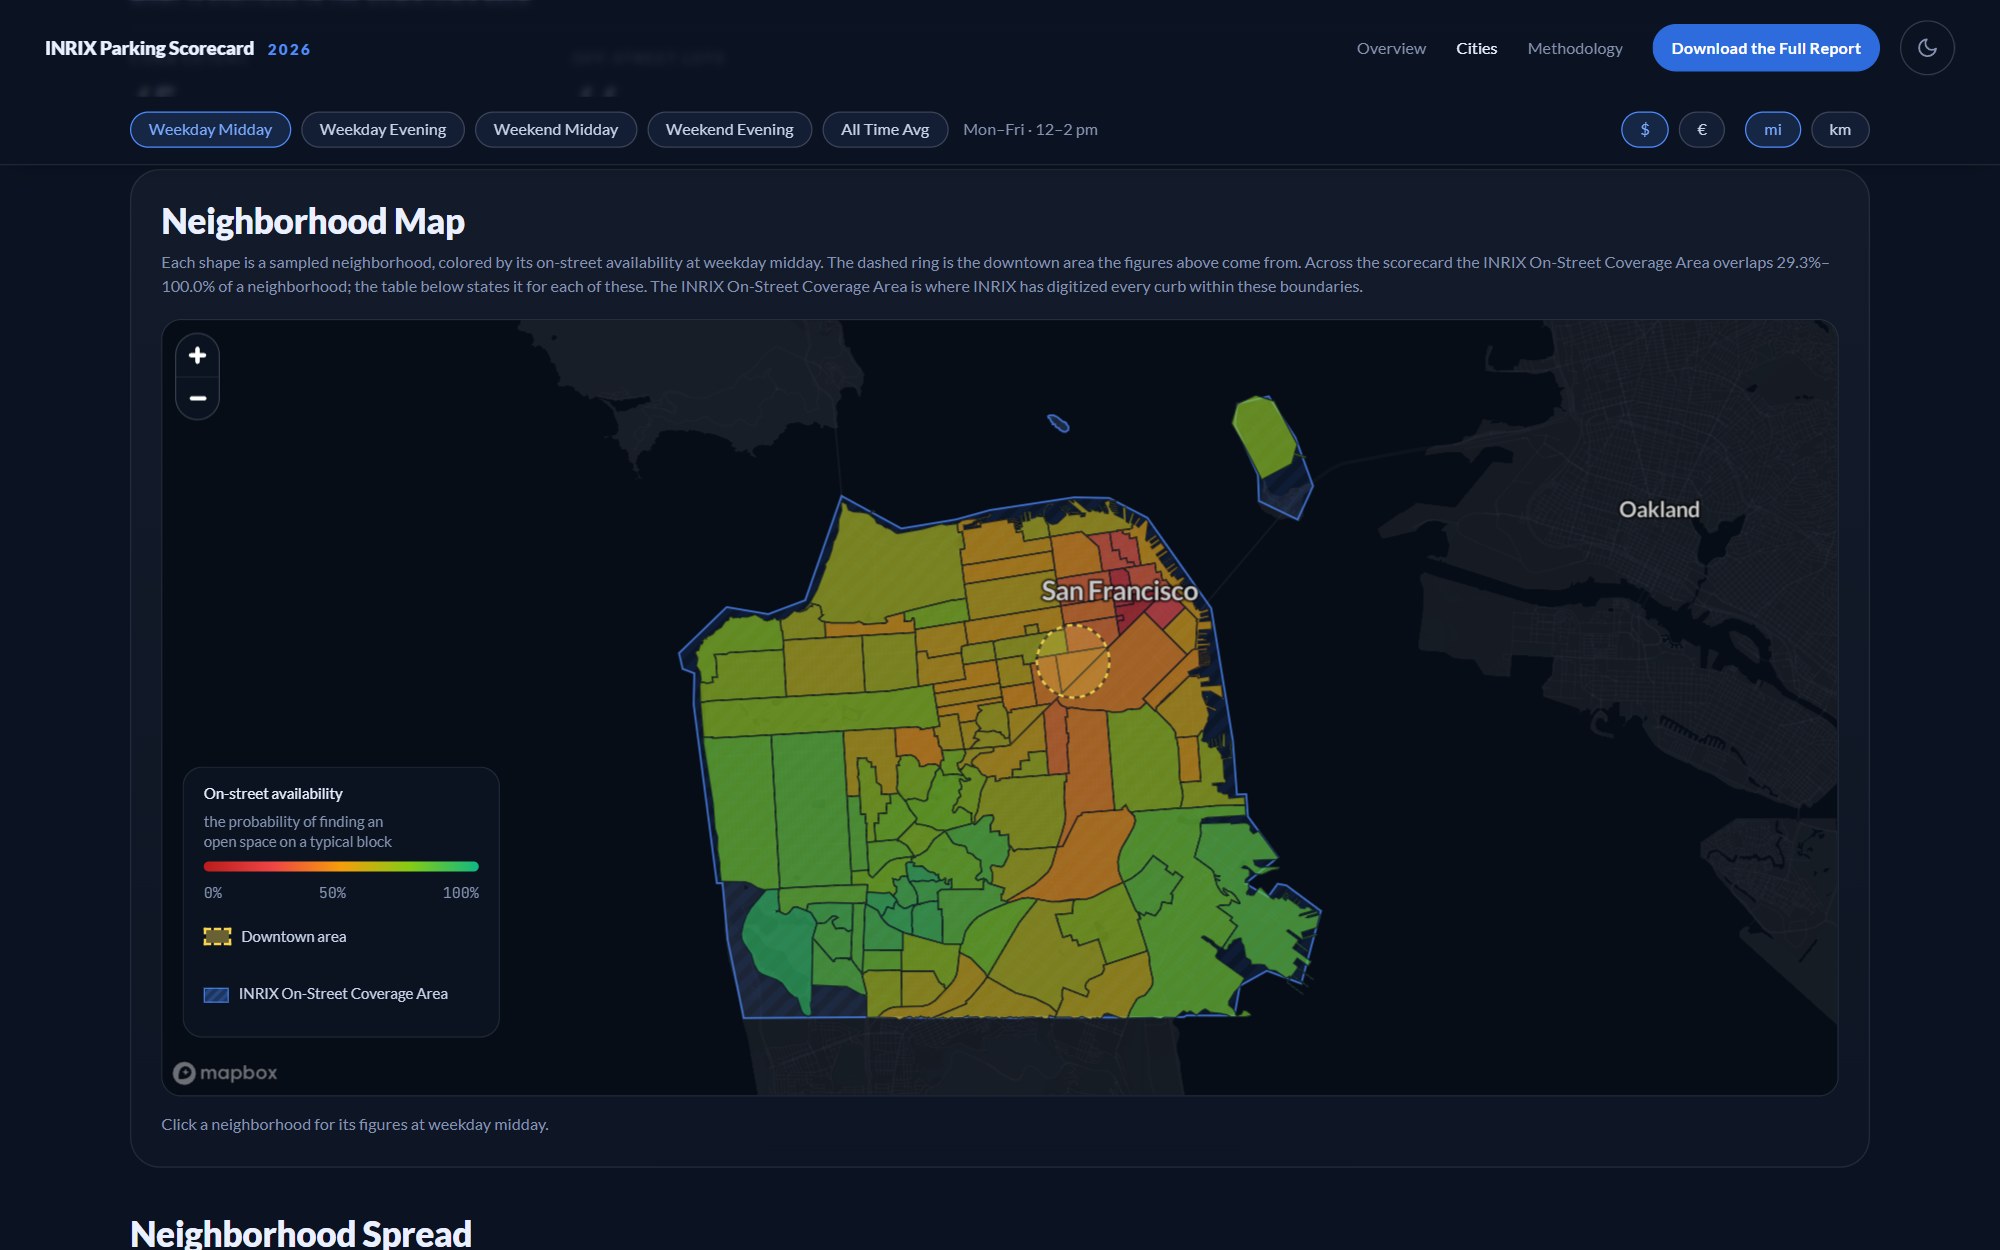
A city with no reading says "No reading" and gets no rank. We never want to draw a missing value as 0%. Neighborhoods that INRIX only partly covers stay in the tables, with a Coverage column next to them so the reader can judge for themselves.
Links had to survive all of this, too. One export respelled a city's name and the build quietly gave that city a new id, which would have broken every bookmark to its page. City ids are now pinned, and a check fails if one ever changes.
The pipeline and the release gate
Three Node scripts with no dependencies turn the export into the JSON and map files the site reads. The larger source file is 34 MB, and a full rebuild takes under ten seconds.
A fourth script acts as the release gate. It runs 247 checks against the output, including totals, rankings, file sizes, and whether every sentence on the overview still matches the data it quotes. It also reads the site's own copy and fails on words the method doesn't support. As an example, "odds" is out because availability is a probability, and "spaces" is out because the scorecard reports a length of curb and a count of lots.
The published data is 10.1 MB against a 12 MB limit, and about 129 KB of it loads before first paint. The front end is plain JavaScript modules with no framework and no build step.
Building with Copilot and agents
I built the site solo, with Claude Code and GitHub Copilot as my engineering team. It started as a prototype in Claude Code and was hardened from there, and inside INRIX it was introduced as one of the company's first AI-native builds. There were two things that made this workable.
The first was writing decisions down. The design principles live in one file and the data rules in another, and the agents read both before they touch anything. Generally speaking, a rule goes into those files once it has cost me an afternoon, like never sizing a scene with a bare 100vh or never keying a city's id on its display name.
The second was the gate. An agent can write a plausible-looking change that moves a number, and I won't always catch it by reading the code, but the 247 checks will. I reviewed design and behavior myself in the browser, in both themes.
The design system
One token file is the only place a color value is allowed to be written. The palette is INRIX's navy, blue, and gold, with gold split into separate tokens for fills, text, lines, and map areas so that each job can be tuned for contrast on its own. I love color theory.
Text is set in Lato. Every figure is set in JetBrains Mono with tabular numerals so that a column of prices lines up on the decimal point, and figures that share a row share one size.
Accessibility
WCAG 2.2 AA was a release requirement, and it was checked in both light and dark. Every drawing and chart has a data table behind it for screen readers. Sortable column headers are real buttons, the time-period control works from the keyboard, and a single reduced-motion setting turns off all of the animation. Light and dark follow your OS or the toggle, and the charts and maps re-theme without a reload.
Prices switch between dollars and euros, and distances between miles and kilometers. "Use my location" finds your nearest city in the browser, so your location never leaves your device.
Shipping inside inrix.com
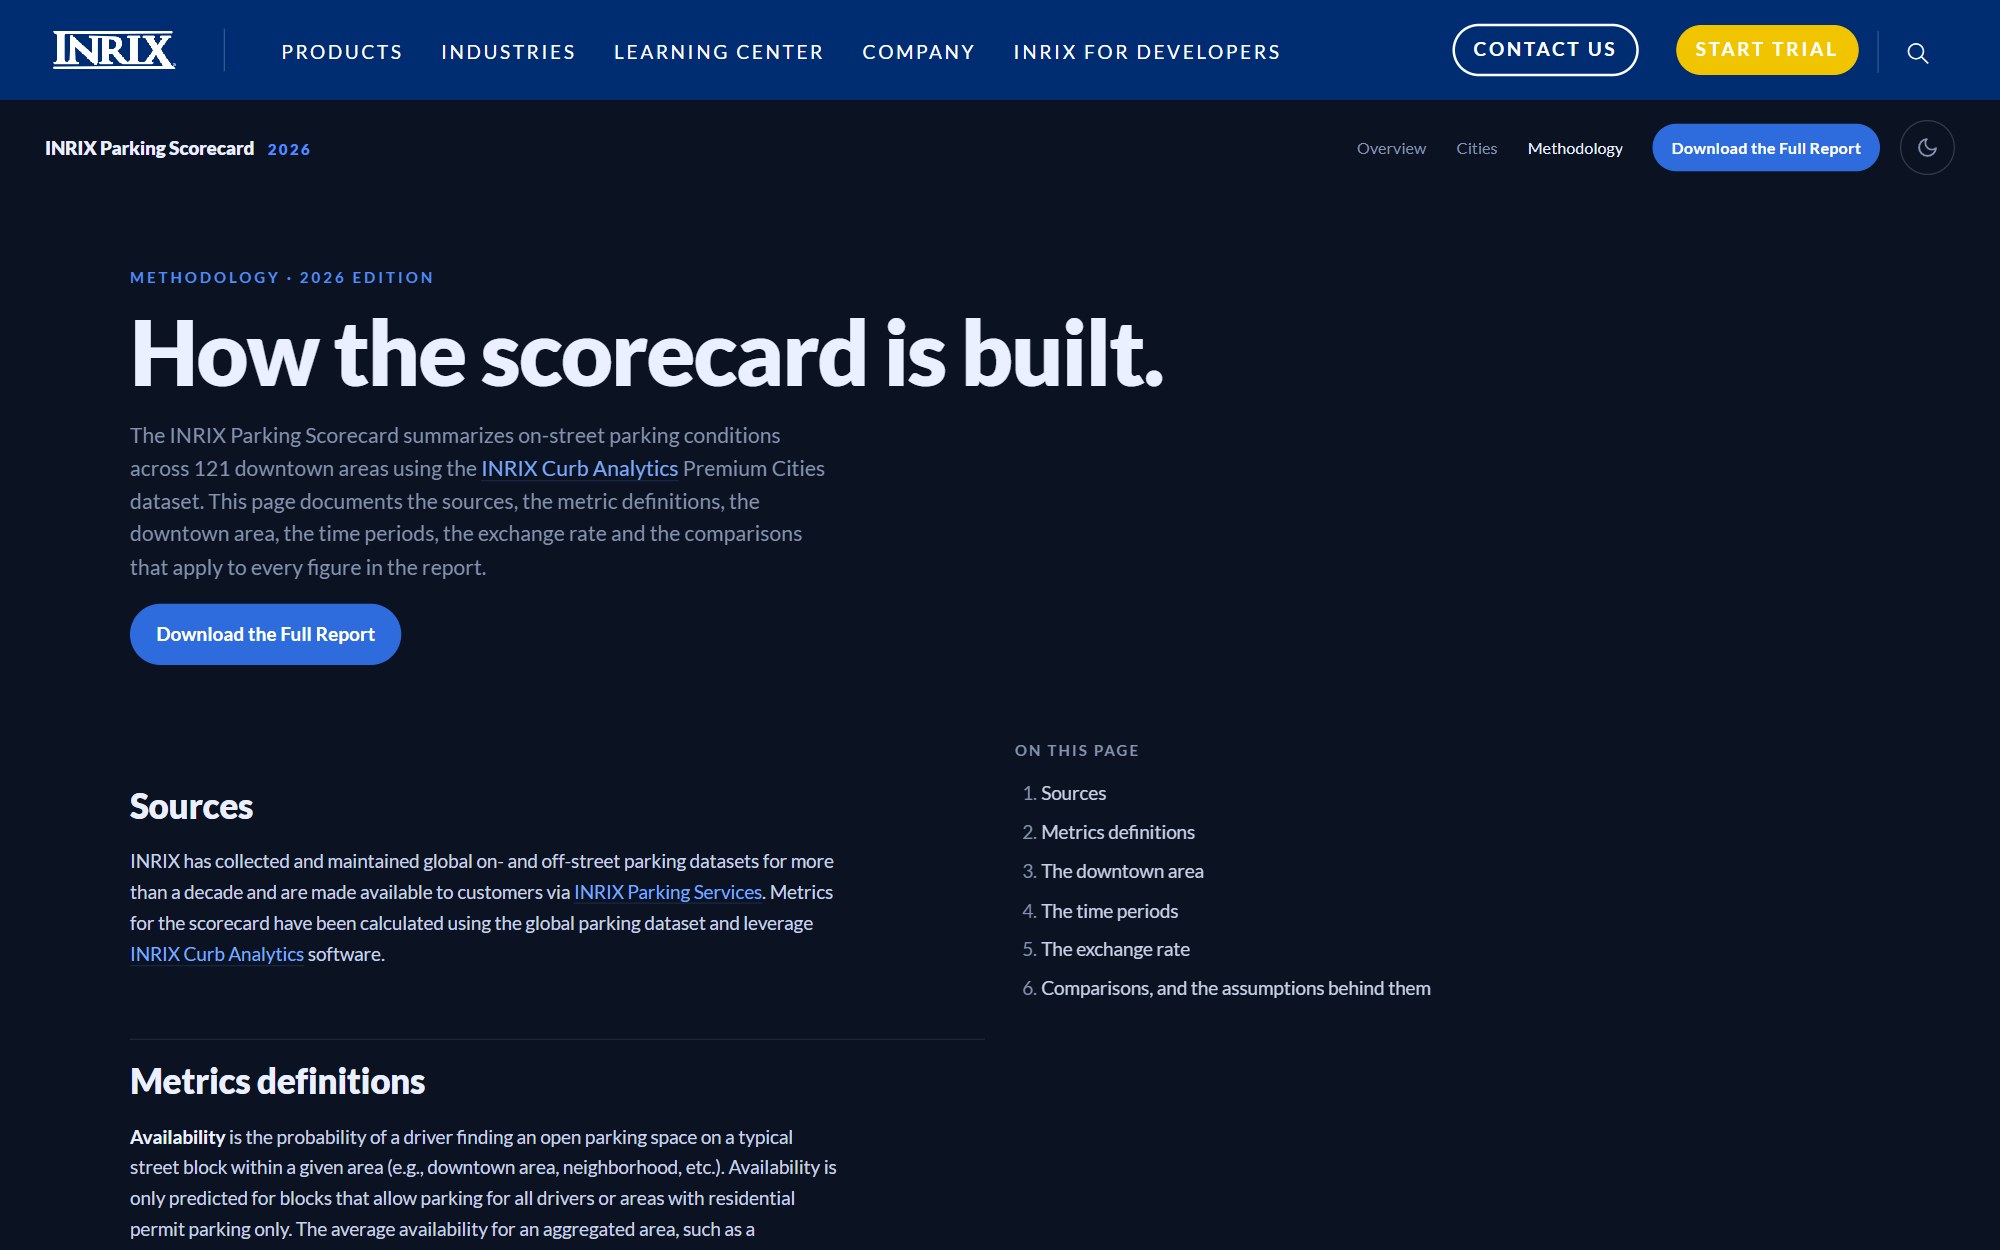
The scorecard runs inside INRIX's WordPress theme, under the company's own navigation. A host page brings its own CSS, and some of it was reaching my tables and headings. To solve for this, I wrote a guard stylesheet that loads last and resets only what I had left unset, along with a short contract for the WordPress team.
Additionally, the scenes were 89 pixels too tall inside the theme, which pushed the bottom of each one below the fold. Scene height and scroll step are now driven by the same token so that they can't drift apart again.
More screens